

REPORTING IS KEY FOR IDENTIFYING “WHAT WORKS” FOR YOUR SOCIAL MEDIA PAGES. READ THIS BLOG TO LEARN HOW TO CREATE A CUSTOM DASHBOARD FOR YOUR SOCIAL MEDIA REPORTS.
As social media managers, we are all too familiar with the importance of reporting. By tracking your posts’ performances, you may have figured out that your audience really likes memes. Maybe it was the simple graphics that created huge engagement? You never really know until you have historical data to compare your efforts to. With that said, it’s time to introduce how easy it is to create a custom analytic report for your social media account that can be 100% free.
One thing to remember: Rome wasn’t built in a day.

If you already use a social media management software for scheduling or reporting, you’re in luck. (We are big fans of Sprout Social!) Sometimes, social media management software provides the option to simply create a PDF report at the touch of a button, but beware. You may only be downloading a PDF with surface-level data that provides little-to-no kick.

This is why we’re writing this blog- to simply break down a complex, yet very necessary process to build and maintain a custom reporting dashboard that is tailored to your brand. But if you don’t use social media software to help manage your content, don’t give up yet! There are promising workarounds.
Step 1: Create a Google Sheets spreadsheet to house all social media data
Once you create a new spreadsheet, make two tabs for each social media platform you plan to track. It’s important to separate your page-level data (think: Page Likes and total Impressions) from your post-level data (think: Comments and Shares).
![]()

Step 2: Export data for set date range
We have a few options here:
Effortless/$$$:
First and foremost, if you want to save time, we recommend purchasing a subscription for Supermetrics. Supermetrics collects all the marketing data you need and it magically appears in the spreadsheet you just created. This is what we use, and it saves hours of time! Also, Supermetrics has access to several integrations like Google Analytics, Ads Manager, Shopify, and so many others that can collect data at the literal click of a button.
Medium effort/$:
If you already use social media management software like Sprout Social, export CSVs of all your page- and post-level data for each social platform.
Have lots of time/no extra $:
- Facebook: Go to your business profile’s Insights page. On the Overview page, click “Export Data” in the top right corner. Select the time frame and export both page- and post-level data. Sort by ascending date, and paste all data, including the column headers into your spreadsheet.
- Instagram: Set daily or weekly reminders to catalogue the Instagram data you want to track. (Unfortunately, Instagram doesn’t allow you to export page- or post-level data from their app.) On your business profile, select “Insights.” Here, you will find data for your content, activity, and audience. Data in Instagram Insights is available for the past seven days. This is why it is very important to check in at least once a week at a recurring time.
- Twitter: Login to Twitter Analytics via desktop.
- Page-level data: Similar to the Instagram Insights process, set weekly check-ins for your Twitter account to ensure you capture all data information. On the homepage of Twitter Analytics, the data you’ll need to track is across the top row and down the right side of this page.
- Post-level data: Click “View all Tweet activity,” select your date range, and export your data.
- Note: You can also export data for other social platforms you use like Pinterest or TikTok. For the sake of keeping things simple, we’re sticking to these three platforms above.
Now that you have all of your CSV exports, copy and paste all of this data to the Google Sheet spreadsheet. Make sure to keep your data organized the same as your exported file so it’s easy to paste new data into your spreadsheet down the road.

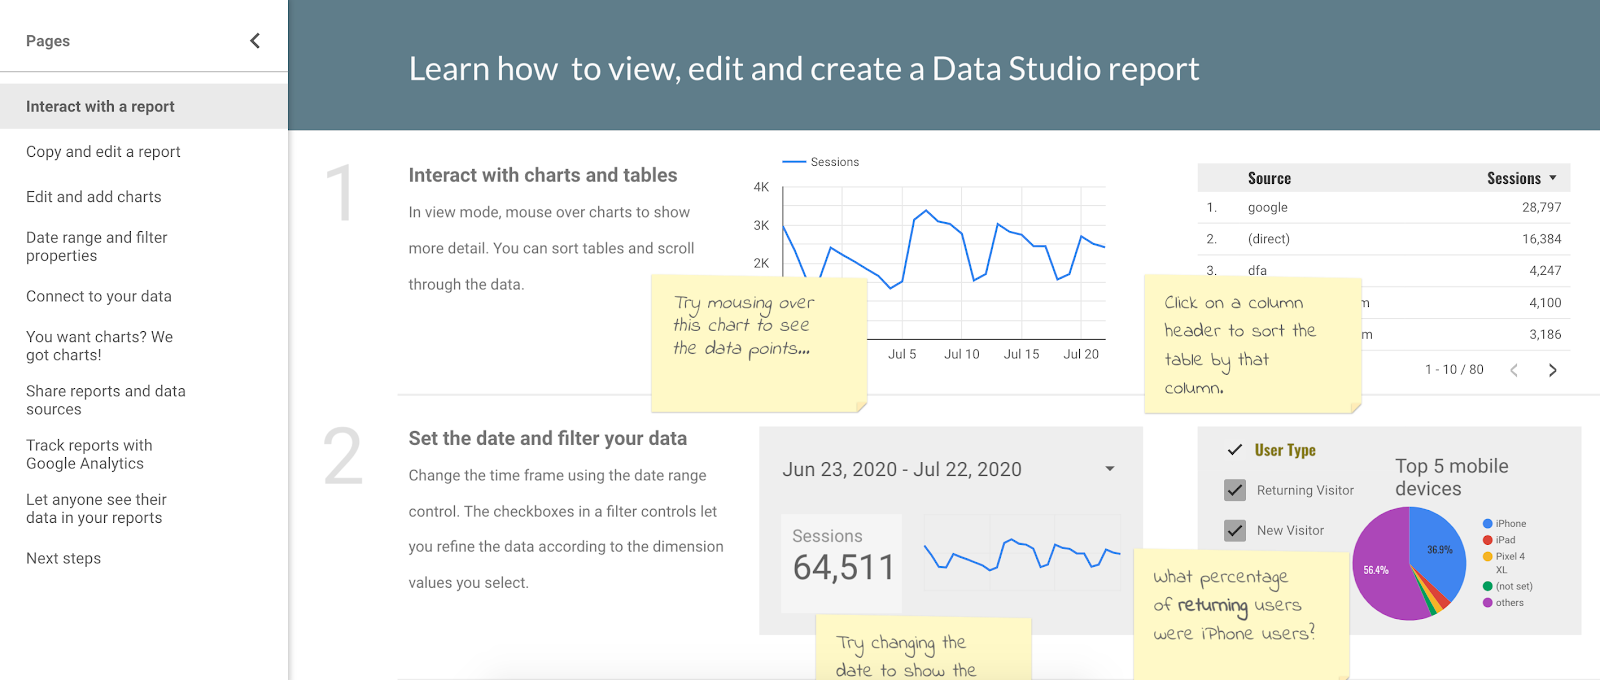
Step 3: Complete this step-by-step tutorial for Google Data Studio
Stick with us! The “hard part” is over. Now, all you have to do is dig deep into Google’s free data visualization tool with this tutorial. Click “Tutorial Report” to get started. In Google Data Studio dashboards, you can customize every little thing. And this tutorial will show you how. Give it some time, and soon enough, you’ll be a Google Data Studio Reporting Genius!

Step 4: Create your Google Data Studio Dashboard
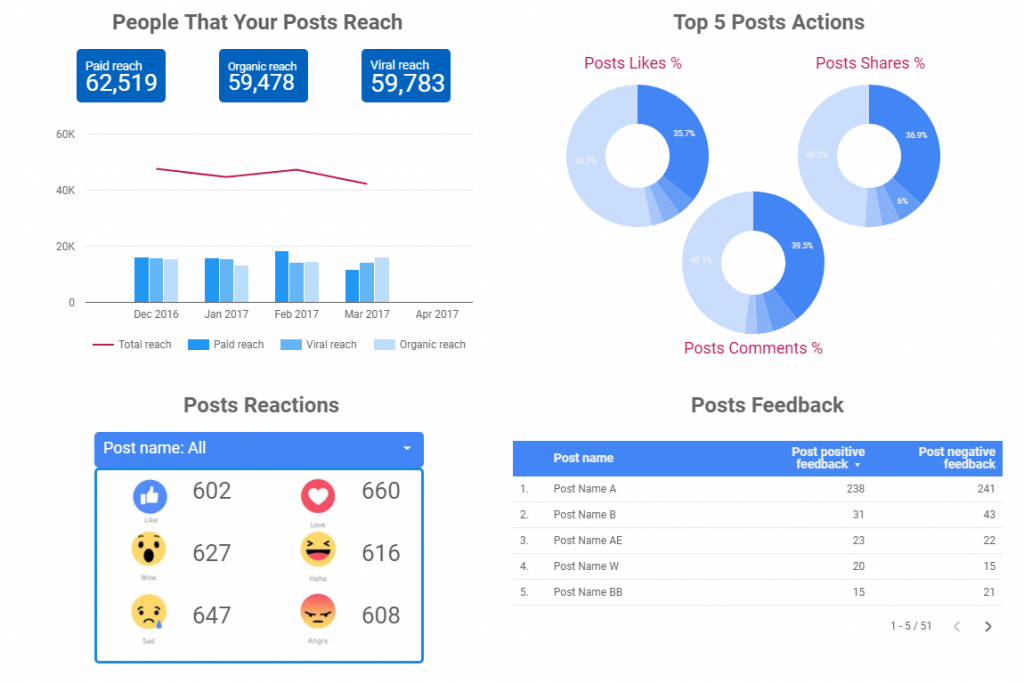
Once you’ve made it to Step 18 of the tutorial (mind blown), you’ll be familiar with all of the tips and tricks to maintain your dashboard. Now it’s time to create your own dashboard! We recommend searching through these templates to find one that suits your brand’s style or create a copy of the below example dashboard we made just for you. (Yes, it’s interactive. Hover over a chart!)

Step 5: Connect your data sources
Once you select your dashboard template, you’ll be prompted to “Add data to report.” Select Google Sheets and select your spreadsheet and worksheet to add it to your report. You’ll repeat this step for each tab, but it’s worth it.

Step 6: Customize your dashboard
This is the fun part! Create a report using your brand colors, logo, fonts, etc. Refer back to the tutorial to create tables, bar charts, line graphs, scorecards, and much more to create a customized and branded report. We recommend creating a sidebar with links to different tabs for each platform.
Step 7: Impress your boss and your coworkers
Yep, that pretty much sums it up.

If you need expert advice about identifying what works for your brand on social media, give our team a call!